April 2025 Market Update

While on the surface it appears there’s not much change happening, there are a couple of things to report. One of which, is the return to 100% interest cost deductibility, a very welcome return it is too! The other is the 1 July Healthy Home deadline and the new Interconnected Smoke Alarm requirements.
Healthy Home Deadline 1 July
From 1 July 2025, all private rentals must meet the Healthy Homes Standards. This is the final compliance deadline for landlords who haven’t already had to meet the requirements. At the moment there is a 120-day grace period from the commencement of a tenancy for landlords to initially meet the standards, from 1 July the property will have to be fully compliant to be tenanted. Failing to comply is not really an option with fines of up to $7,200 available to the Tribunal.
Landlords are responsible for ensuring the property meets and continues to meet the standards throughout the occupancy of the property. Most non compliances can be detected by routine inspection or reported to us by the tenants - the only one that won’t be, is the insulation. Glass fibre (Pink Batts) do settle and degrade over time, they are required to be 120mm thick as a minimum, for older properties with original ceiling insulation we will be keeping a particular interest to ensure compliance is meet.
A Building Code Change requires new properties to have Interconnected Smoke Alarms but builders and developers should be taking care of that on any new build. So while it’s a factor for an investment property owner, we are not expecting any additional work flow for this.
Official Cash Rate Cut to Expected 3.5%
The Reserve Bank cut the official cash rate another 25 basis points to 3.5% on 9 April as most had expected. This time last year it was a hold at 5.5%.
In a statement, the Reserve Bank said annual consumer price inflation remains close to the mid-point of the 1% to 3% target band.
“While monetary restraint has been removed at pace, household spending and residential investment have remained weak,” the committee said.
“The recently announced increases in global trade barriers weaken the outlook for global economic activity. On balance, these developments create downside risks to the outlook for economic activity and inflation in New Zealand.”
“Having consumer price inflation close to the middle of its target band puts the committee in the best position to respond to developments. As the extent and effect of tariff policies become clearer, the committee has scope to lower the OCR further as appropriate.”
Banks followed suit with Westpac due to drop its Choices Floating and Choices Offset home loan rates by 0.25% to 6.74%, and its Choices Everyday advertised revolving rate by 0.25% to 6.84%, effective April 14 for new customers and April 21 for existing customers.
Most of Westpac’s variable business loan rates reduced by 0.25%, with Kiwibank adjusting its home lending and business variable rates and ASB dropped its variable interest rates across home lending, business and rural lending by 0.25%.
ANZ then followed with announced cuts to its floating home loan interest rates and savings rates, dropping by 0.2%. ANZ’s Floating home loan rate dropped to 6.69% and its Flexible loan drops to 6.80%. Its Serious Saver rate will also decrease by 0.2%.
BNZ was a bit slower dropping its variable home loan rates by 0.25% effective from April 16.
Banks have also demonstrated some room to move on their advertised rates, the yield picture is starting to close with the reduction in lending costs. It will be interesting to see how that effects the market going forward.
We have 2025 from The Minister of Finance, Hon Nicola Willis to look forward to on 22 May 2025. I’m with the majority not expecting any stimulus package’s to be rolled out from our friends in Wellington.
Home Building Flat
In early April, Statistics NZ released their monthly data on the number of consents issued around the country for new dwellings to be built. The monthly numbers can be quite volatile, even after adjusting for seasonal factors, most smooth things over a three-month period to truly see what is happening (which is why a monthly GDP reading would largely be a waste of time).
Consents rose 0.8% in February - we saw growth in the three months leading up to that month of 2.5% which followed a rise of 4.3% in the three months to November and fall of 5.8% in the three months to August.

There is no consistent rise or fall underway and this is why the annual total of 33,600 is the same as it was in June. But a year ago the total was 36,300 so there has been weakness this past year but it was mainly when the economy was shrinking 1.1% a quarter.

Things have plateaued overall. I expect an upturn in standalone house construction to get underway later this year but for townhouses the track is likely to be down until well into 2026 when interest rates bottom out and there is some comfort in the cost of money. There is reported over-supply of townhouses in our two biggest cities and some buyer reservations and worries about project completion for off the plan purchases, and the increased availability at this point in the cycle of standalone houses make them more appetising.
Residential Construction is very affordable at the moment with many firms looking for contracts, it’s a great time to build.
And To The Local Market…
When Trade Me's Rental Property Index headline reads “Rental listings soar to highest in over a decade”, it’s something that doesn’t come as a surprise to us. I’m not sure that the stock has increased significantly but the demand has dropped away due to negative net migration and other factors leaving some of the existing stock available, when historically it would remain occupied.
The data reveals that Trade Me Property rental listings have hit a more than 10-year high.
Year-on-year comparisons show rental listings to be up by 41% in March 2025, with inventory at the highest it’s been since early 2014.
Trade Me Property Customer Director, Gavin Lloyd says “those seeking residential rental accommodation should feel empowered, there’s a wider range of options available and tenants have more negotiating power than they have had in years.”
National Rent Down In March
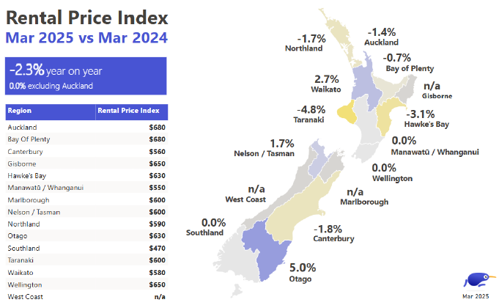
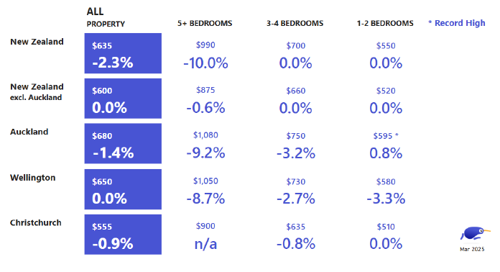
The national median weekly rent in March fell 0.8% or $5 per week on February to $635, and is down 2.3% year-on-year.
“Compared to March 2024, tenants are saving an average of $15 a week, which would add up to just under $800 a year.
“With a rental market that’s historically favoured landlords, the changing dynamics and cost-saving benefits are sure to be warmly welcomed by renters.”
The national average asking price for a property was recorded at $885,100 - up 2.2% compared to the same time last year.
Gavin Lloyd says despite the nationwide fall in the national median, tenants in some regions may feel hard done by.
“Nelson/Tasman's median weekly rent reached a new record high of $600 in March, up from $585 in February and $10 on March 2024.
“Popularity as a lifestyle destination, coupled with seasonal tourism, can lead to increased demand and limited housing availability. Additionally, local economic growth may be attracting new residents, further driving up rental prices in the region.”
Otago has also experienced a notable surge with the median weekly rent in the region sitting at $630, up 5% both month-on-month and year-on-year. This growth is further underscored by Otago’s current inventory, which is up 16% on March 2024.
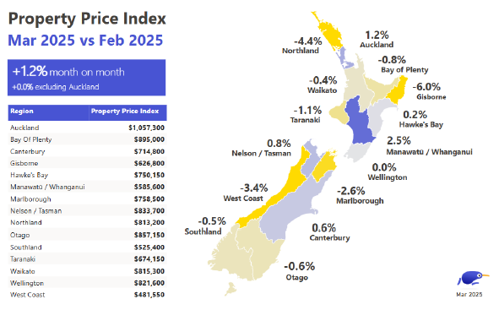
The good news is that on a values front the tail end of summer saw the country’s housing market continue to warm, with property prices up in February, and demand at a more than four year high.
Canterbury is the only one of the three big cities to show both month-on-month (+0.6%) and year-on-year (+0.2%) growth in March. While the increases in average asking prices in Canterbury are modest, they are in contrast to both Auckland where prices are down more than 2% on last March, and Wellington which sits at 3.7% behind the same month last year.
Available properties here as shown on Trademe, are continuing to increase in number through to around 1165, up from the mid 700’s this time last year. That sounds like a lot but historically it is still below the long-term average. The abundance of supply is working well to reduce the pressure on the rents and will do so for the foreseeable future until supply is taken up.
Average days to rent are still around the same time as last month, Christchurch 21, Selwyn 18, Rolleston and Waimakariri both being 16.
As always, we do truly appreciate your business and the team and I are always just a phone call away. We are always available for a free chat and are happy to share our experience and knowledge wherever we can be helpful.